Men at work

Back from holidays; after the week (and a long weekend) when I drove 300 kilometers a day, spent 20 hours on average in all cities visited and slept in a different bed every night, I can say: batteries are charged.

It’s hard to fit in yet – whenever I close my eyes, the road seems moving fast. The 100+ unanswered e-mails and the 5000+ RSS flood is over though, and apart from knowing nothing about the Olympics, it feels like being back in the world again.

Some finishing thoughts:

1. Holidays are for disconnecting from the world. Even if you plan to tweet and blog, if you are switched off, it won’t work. (And it shouldn’t.)

2. When driving in Czech, ignore all the signs of the road and leave everything to the GPS. We actually have reached the end of a road in a forest, following the Prague signs.

3. If holidays feel more tiring than daily work, it still can work out as a switch off. Perhaps it comes down to the mindset of time out, I don’t know. It just works.

j j j

Drawing a weekly comic with the iPad

The first time I drew Frederique was about ten years ago, and since then, my preferred drawing technique didn’t change much: on paper, with ink or a black rollerball pen. As a disaster, I didn’t have access to a scanner the night the first episode should have been released, therefore I was forced to rethink my options – and I fired up the iPad.


From the first touch to the last: drawing on iPad, correcting vectors and finalizing graphics

There were of course plenty of other options: I could have reused my old drawings, or chose a more familiar digital tool like Photoshop or Illustrator. I wanted to go for something handmade though, and drawing with fingertips is quite similar to using a real pen – just that it has a built-in cheat, the option to correct the lines later. (But yeah, isn’t the eraser made for the same thing?)

This wasn’t the first time I used the iPad to do drawings though. I had a few goes with tons of apps, both raster- and vector-based. Because I wanted to have the comics in color, I went for the vector-based option, using neu.Notes+ (currently for 0.99$). This is a brilliant little app with great drawing tools and with a killer feature: it exports PDF files to Dropbox which can be directly fed into Illustrator from there – so that everything I draw with my fingers can be later edited with a professional tool that I use on a daily basis.


Tools optimized for touchscreens (neu.Notes) and trackpads (Illustrator)

Even with the already known tools, I’ve spent about 8 hours on the first episode: drawing, redrawing, checking on the computer, redrawing and finalizing the vectors on the iPad (unfortunately at this time, the PDF files cannot be transferred back), correcting the vectors in Illustrator, coloring, adding shadows and more details, and exporting the whole lot from Photoshop.

Since then I made ten episodes and some more images, practiced the finger-drawing and optimized the workflow a lot – now I’m down to around 4 hours per episode, which is about pen-and-ink-time. And there’s something even better to this process. Thanks to the vector-based graphics, I have a lot more options open: maybe one day we will see all these characters filled with life – and dancing in a cartoon.

j j j

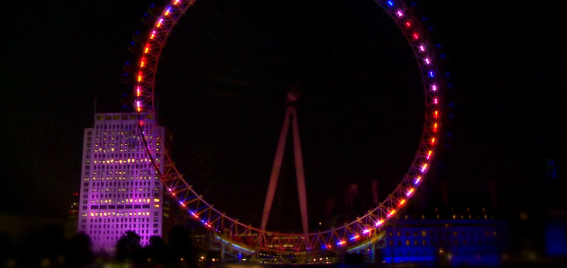
London Eye will be lit up by Olympic tweets

One of London’s most important landmarks got a spectacular decoration for the Olympics from EDF Energy: the lights will change their color according to tweets sent with the hash tag #Energy2012.


Lightshow and more info on edfenergy.com

The company developed an algorithm that filters tweets, and the more positive tweeps are, the more lights on the wheel will be lit. The highs and lows of the day’s major sport events, together with Twitter results will be displayed every night in form of a lightshow, between 9pm and 10pm on the EDF Energy London Eye.

j j j

Run, Forrest, Run (and track it)

Tracking runs and other sports is great fun, even if it means carrying another device. I got addicted to more data about my runs sometime last Summer, and tried half a dozen of apps since then. Now that the last update broke ‘My Tracks’ on my phone, it was time to look for a new one.

To look for a tracking app on Google Play is not easy though. There are hundreds of them out there, almost indistinguishable from each other and to make matters worse, I already have some preferences. They should be small, easy to use, easy to set up – and especially, don’t need any kind of registration or whatsoever. In fact, the less features the app has, the more I should like it: display the position on a map, measure time and speed – that’s all one can need.

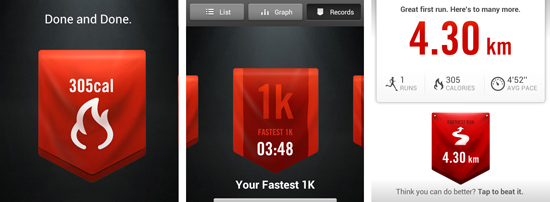
I can’t really say why I did download Nike’s running app then. You have to register on nike.com before the first use. I don’t want to share anything on my Facebook wall. The app is huge. (16 MB, really? Will it do my runs for me?) And it’s not made by some nice indie developers on an island, but Nike, a giant. Yet, I did download it and tried it just now.

And I loved it!

The registration is annoying. I don’t even know what a calorie is, but it keeps showing me how many less of those I have. It always wants to share my embarrassing results with my friends and followers. But there is something to it that I really liked.

Great graphics, for starters. And while I’m not at all interested in calories, I really do like how it is displayed, together with the longest distance, fastest run etc -it’s just great to look at those screens. The whole lot is perfectly made and has some spirit, some unique touch to it. And the best thing is: I can’t wait for the next time to use it.

This app is a brilliant lifestyle product. Nothing less.

j j j

Timelapse layer for Google Earth

To celebrate Landsat’s 40th birthday, Google made available a bunch of timelapse videos about Earth’s surface. With that, can watch the globe change over the last decade: the growing Las Vegas, the deforestation of the Amazon or the Aral Sea drying out. Amazing pictures and some food for thought.


more info and videos on Google Earth Engine

Google Earth Engine brings together the world’s satellite imagery — trillions of scientific measurements dating back almost 40 years — and makes it available online with tools for scientists, independent researchers, and nations to mine this massive warehouse of data to detect changes, map trends and quantify differences on the Earth’s surface. Applications include: detecting deforestation, classifying land cover, estimating forest biomass and carbon, and mapping the world’s roadless areas.

via 9to5Google

j j j

Inspiration: Indie Game – the Movie

The first rule for using my computer was, not to play games. A bit later, to play only with those I wrote. Of course I cheated from time to time, but at least I had a few goes making them – only to gain enough experience to know that this is an extremely hard thing to do. Maybe this is why watching Indie Game – the Movie was so catching, but nevertheless, it’s great fun to watch these guys sweating blood and tears for success.

First-time filmmaking duo Lisanne Pajot and James Swirsky capture the emotional journey of these meticulously obsessive artists who devote their lives to their interactive art. Four developers, three games, and one ultimate goal – to express oneself through a video game.

You can watch the whole movie online at indiegamethemovie.com.

(In the meantime I get off the shelf my most recent game loop. Muwhahaha!)

j j j

My first pizza dough

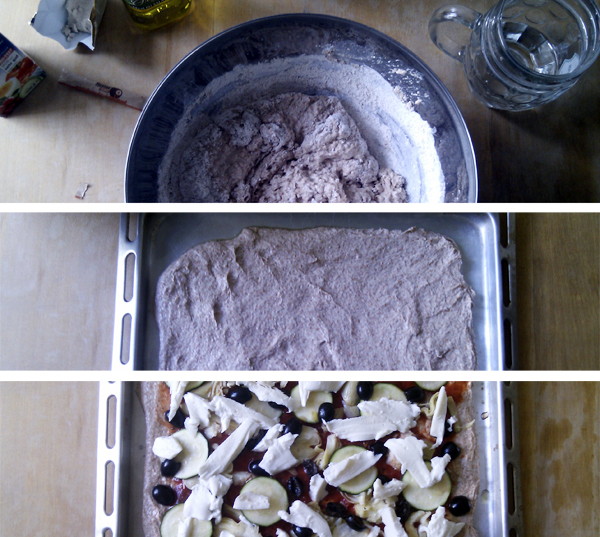
Another rainy afternoon spent inside, I decided to a make pizza – including the dough -, on my own. (And the Sun came out in the end!)


one shouldn’t take gastrophotos with a phone…

Being into healthy food and cooking to some extent, making my own pizza dough is something I wanted to do for a long time now. It’s cool. It’s tough. It’s a man’s job.

And it’s not that hard either. Following Jamie Oliver’s recipe – being unlucky with the video pages which were down at the time -, I managed to do everything in about 75 minutes. That includes cleaning the table in the beginning and cutting up the slices in the end, so I probably will do this again – and encourage everyone to try it once. As for me, the next step will be the Chinese boutsa from scratch.

Served with Syrah from Sicily. Bliss!

j j j

World Touristiness Map

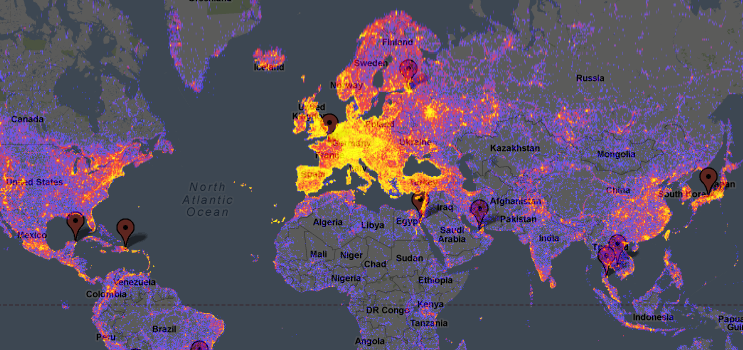
It’s the middle of Summer, when people either spend their holidays or are in offices, looking for holiday offers and places to visit. During my daily session of such discoveries I bumped into a map, collecting the world’s most touristy places – you may want to visit or avoid them, this map will be of use.


The map on Google Maps

The map has been created by Bluemoon, based on the meta tags of photos uploaded to Panoramio: “Yellow indicates high touristiness, red medium touristiness, and blue low touristiness. Areas having no Panoramio photos at all are grey. The analysis takes into account how many photos and by how many authors there are in a given area.”

How relevant it is for my search is hard to tell – probably not very. According to Facebook’s recent study on which social landmarks people visit the most, whatever masses think is worth visit is simply weird: what is there to see (or at least, check in for) at Kurfürstendamm?

j j j

The Görlitzer Crater

One usual weekend program for Berlin is to sit around in Görlitzer Park, drink beers and have talks with friends while enjoying the Summer breeze. There is a huge crater somewhere in the middle where we used to settle – it is a nice spot covered with grass, but it’s quite a mystery as well: how did it get there? Was it really a bomb during the wars as other Berlin expats say?
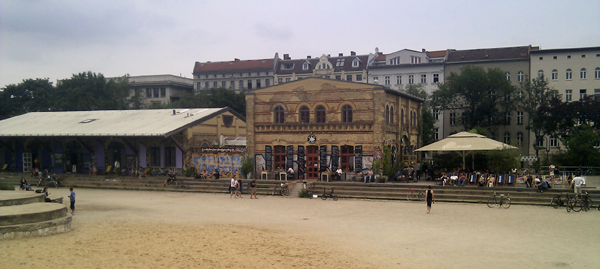

Traces from the past: office building of the Görlitzer Bahnhof railway station

Because today it’s raining cats and dogs out there and we don’t have the option to go out anyway, I finally had the time to do my research on the topic. Who knows? Maybe I can end those rumors completely, or, if there was a bomb, I can tell when and where it actually went off.

Well, the story starts with Görlitzer Park being a railway station before.
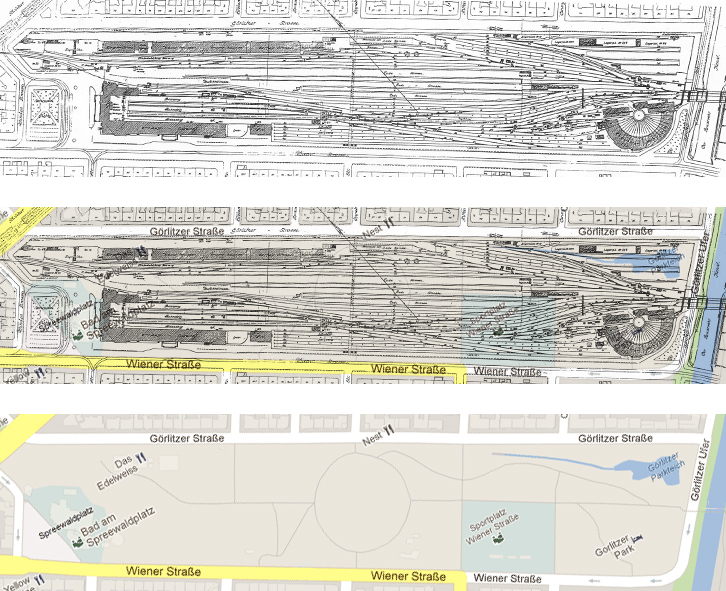

Gleisplan from 1925 and Google Maps from 2012

The railway career of the now park and seasonal football stadium started in 1867, and lasted until 1951 – when all the trains going through West-Berlin from here were departing from Osktreuz instead. Although according to maps, the station was already demolished by 1954, it actually remained relatively undisturbed for ten more years, until the Wall has been built up and all the hopes for a reconstruction were gone. (More about the history on Wikipedia.)
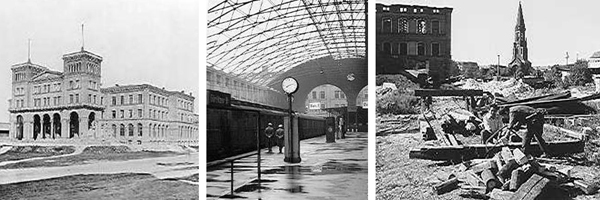

The station in 1879, 1946, and people collecting wood in 1975, to use for heating their homes.
Images by © Landesbildstelle Berlin

Berliners are famous of reusing whatever they can – and traces of the railway station can still be found all over the park: some goods sheds and office buildings are used until this day, and there is a swimming bath built on the site of the former station. The old railway bridge offers a foot path to cross the Landwehrkanal and walk to Treptow.

I wanted to know about the crater though, and at this point it could have been a service pit as well as something made by the rumored bomb. The Wikipedia article mentioned the Görlitzer Tunnel that was opened to the public in 1910 – an underpass, connecting Oppelner Strasse and Liegnitzer Strasse. Suits well: it’s right where the crater is – was it maybe bombed?


The Görlitzer Tunnel in 1989 and the crater in 2012 (archive photo from the German WikiPedia)

The photo above shows the tunnel in 1989 in a rather good state, and according to the article the tunnel remained in use until the early 90s. When the area has been developed into the Görlitzer Park of today though, as soon as pedestrians had public access to the park, the tunnel became redundant – and later that decade it has been destroyed, creating the mysterious crater.

No bombs from the World War involved.

Sources of information used in this post, that were not directly linked (yet): 3D models of the station, Senate Department for Urban Development

j j j

Touchscreens with something more to touch

Right after we got used to touchscreen keyboards and threw away our old devices full off buttons, a company wants to bring those keys back. Tactus Technology invented a user interface, where completely transparent physical inputs rise up from the touch-screen surface on demand, all controlled by the applications.

Tactus Technology Introduction from Tactus Technology Inc. on Vimeo.

One could say that for everyday users it’s completely useless to have buttons or physical feedback while typing: most of the people even switch off the haptic feedback while typing on Android. Nevertheless, it could be of use for people who need assistance, or work in a less ideal environment – say, a DJ playing and using an iPad on the stage, and with the Tactile Layer finds all the controls without looking.

We will see. Based on what the guys write on their webpage, the technology could come into our lives as soon as by tomorrow:

With the buttons enabled, users can push and type or rest their fingers as they would with any physical button or keyboard. When the buttons are disabled, they recede into the screen, becoming invisible and leaving a smooth, seamless flat touch-screen with maximum viewing area.

Our Tactile Layer technology easily integrates with today’s touchscreen-based devices (smart phones, tablets, personal navigation systems, gaming devices, etc.) by simply replacing the front layer of the display stack, known as the “lens”, “window” or “cover glass”. Our dynamic Tactile Layer component is the same thickness as the layer it replaces and requires no change to the underlying display or touch sensor.

j j j